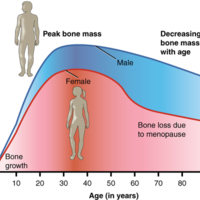
Graph Showing Relationship Between Age and Bone Mass
Dublin Core
Description
Bone density peaks at about 30 years of age. Women lose bone mass more rapidly than men.
Contributor
Cut Rita Zahara
Rights
Creative Commons
Type
Files
Collection
Citation
“Graph Showing Relationship Between Age and Bone Mass ,” Open Educational Resources (OER) , accessed February 17, 2026, https://oer.uinsyahada.ac.id/items/show/1040.


